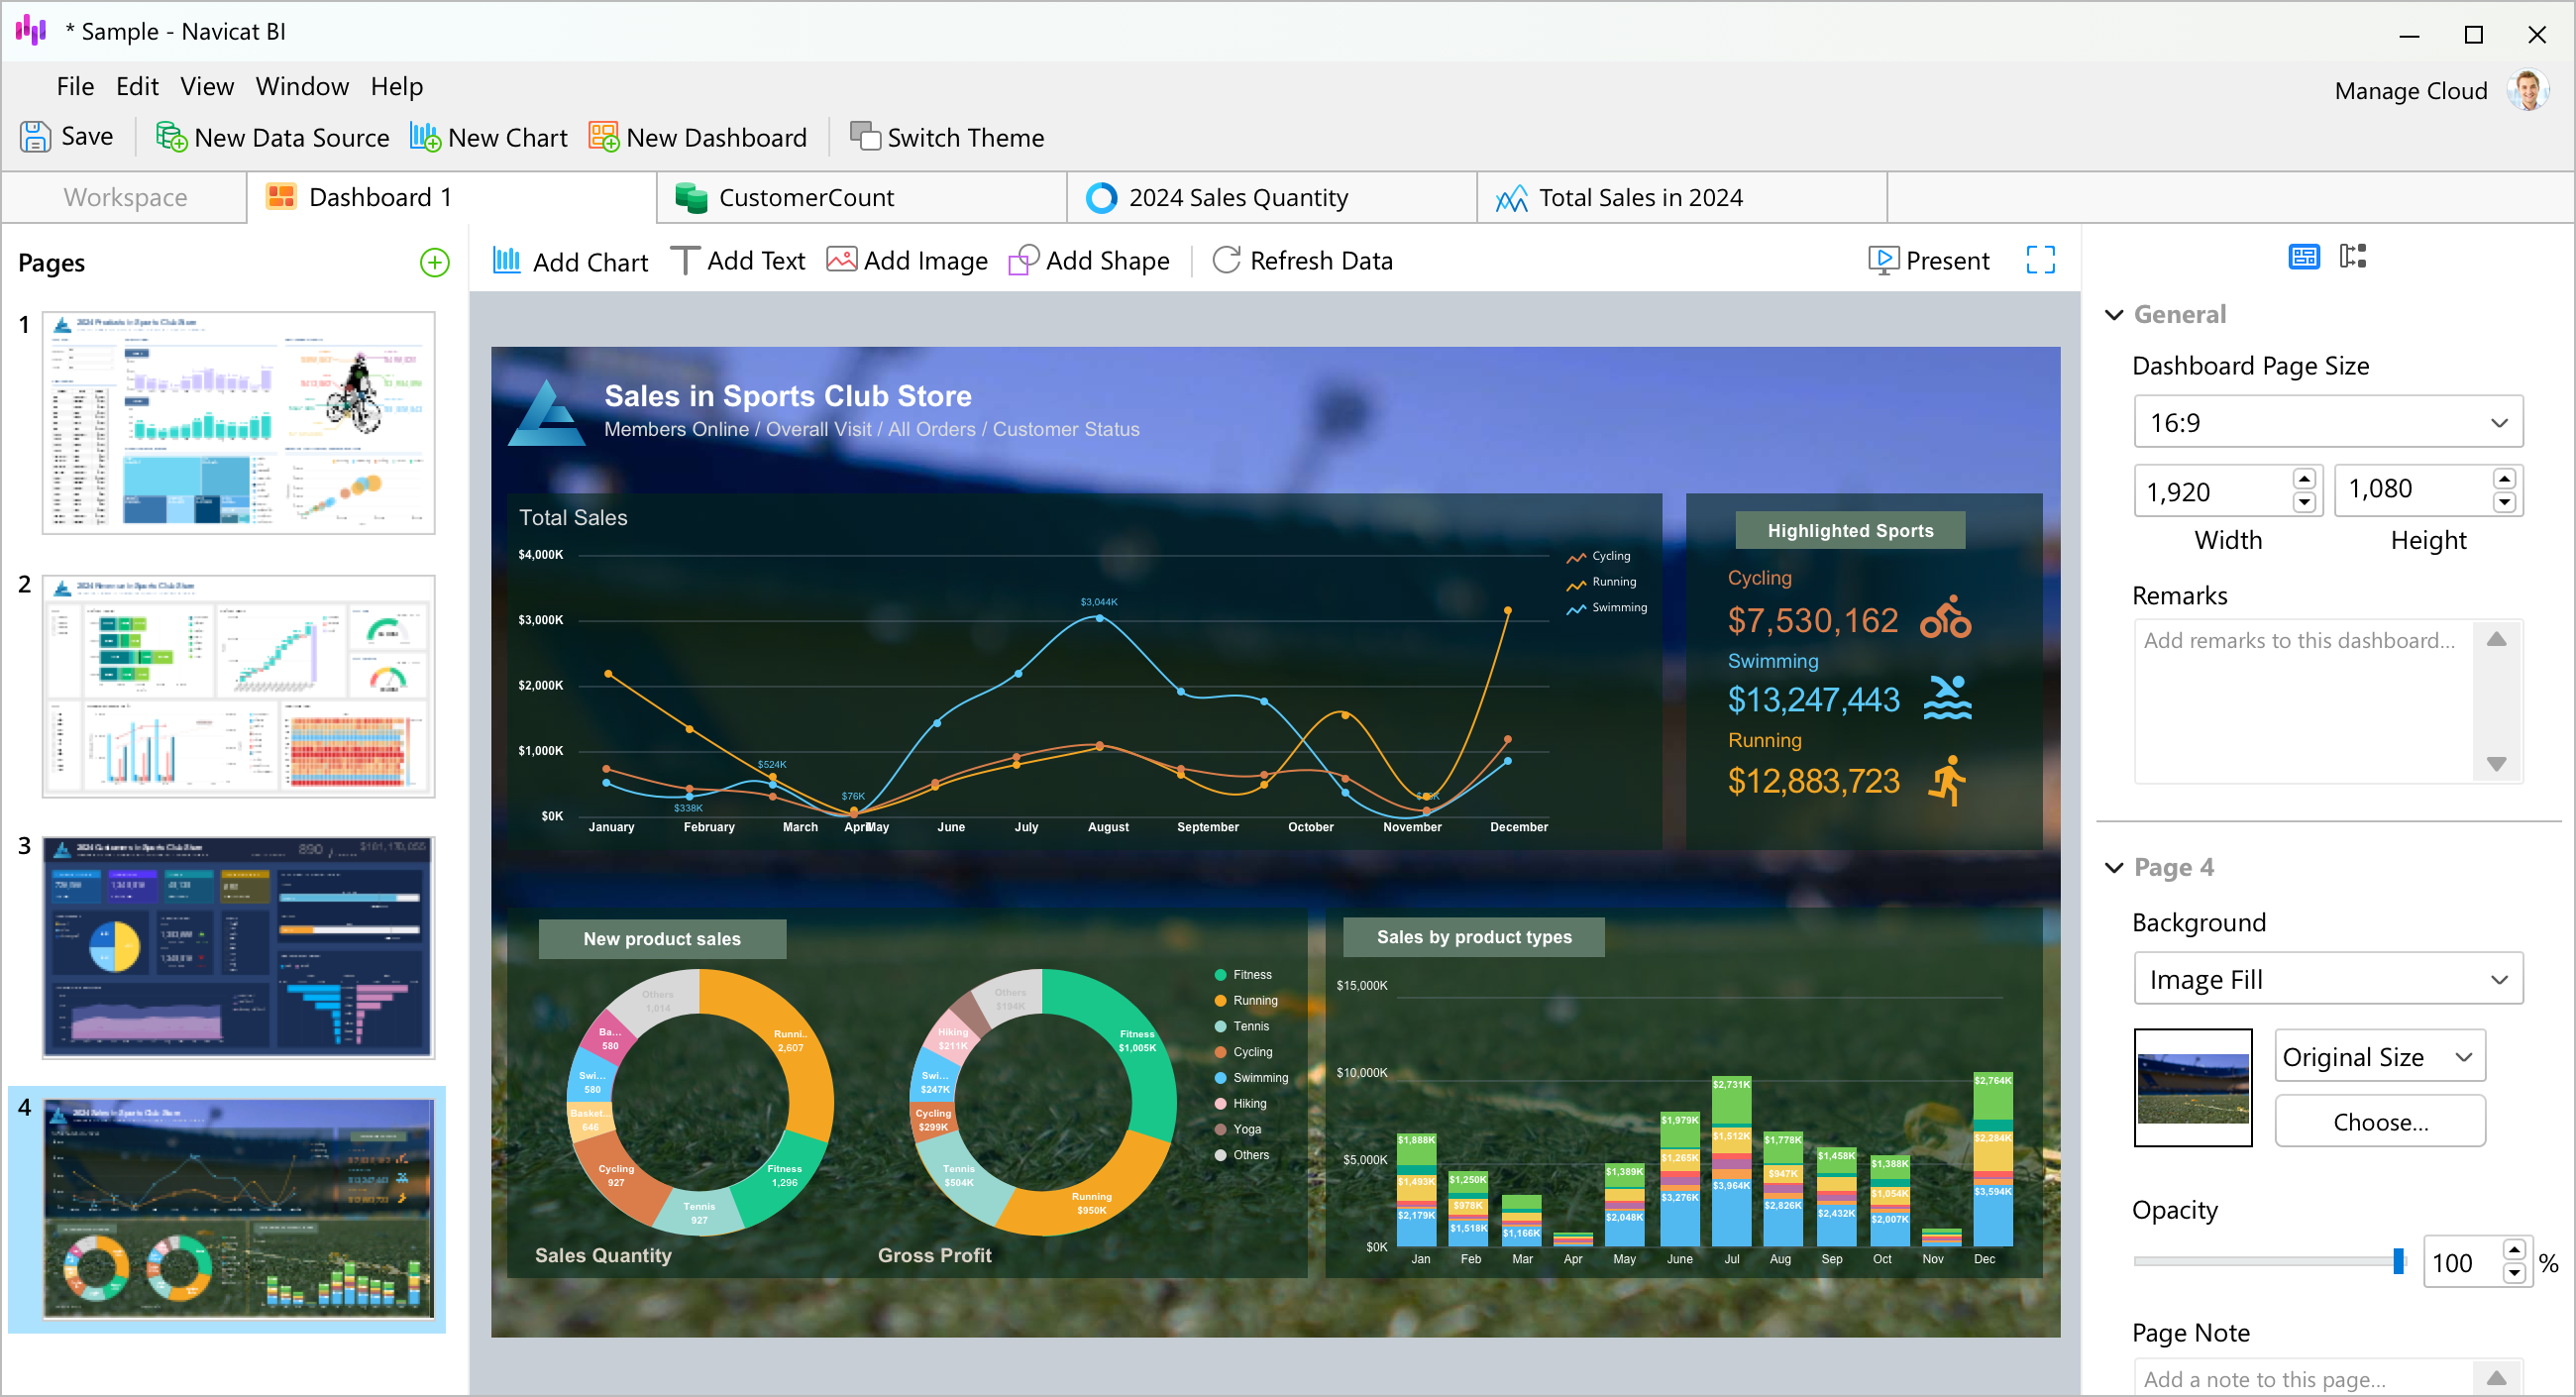
Navicat BI for Data Visualisation and Business Dashboards

Navicat BI sample data visualisation

Organizations collect large amounts of information through sales systems, customer databases, finance applications, service platforms, and operational systems.

However, information stored in a database is only valuable when decision-makers can understand and act on it.

Navicat BI supports the data exploration and visualization stages of business intelligence. Users can create interactive dashboards and share workspaces with colleagues to support collaborative decision-making.

According to Navicat BI, the platform enables users to transform business data into visual insights through dashboards, reports, and interactive analysis.

Connect to Business Data

Navicat BI provides data connectors that allow users to access supported data sources and prepare information for analysis.

The exact connection requirements will depend on:

  • Database platform
  • Authentication method
  • Server configuration
  • Network security policies

As a business intelligence platform, Navicat BI helps organizations centralize data analysis while enabling access to information from multiple business systems.

Explore and Profile Data

Before building dashboards, users need to understand the quality and structure of the underlying information.

Data profiling can help identify:

  • Missing values
  • Unexpected values
  • Data distribution
  • Potential inconsistencies
  • Fields requiring additional data cleansing

By understanding data quality early, teams can create more reliable reports and business analytics dashboards.

According to Navicat BI Features, data exploration capabilities help users better understand datasets before developing visualizations.

Build Visualisations

Charts and visual elements make business information easier to interpret.

Possible applications include:

  • Sales performance dashboards
  • Customer service reporting
  • Project performance monitoring
  • Inventory analysis
  • Financial summaries
  • Operational trend reporting
  • Management scorecards

Using Navicat BI, organizations can transform raw information into data visualisation software outputs that are easier for decision-makers to understand.

Create Interactive Dashboards

One of the key advantages of Navicat BI is the ability to create interactive dashboards.

Charts connected to the same data source can interact with one another. User selections can update related visualisations, allowing decision-makers to explore information without requiring a separate static report for every question.

This allows teams to identify trends, investigate issues, and support better decision-making through dynamic analysis rather than static reporting.

Start with a Clear Business Question

A successful dashboard should not begin with charts.

It should begin with a decision the organization needs to make.

Examples include:

  • Which products are experiencing growth?
  • Which customers require attention?
  • Which departments are exceeding budget?
  • Where are service delays occurring?
  • Which locations are performing below target?

By focusing on business outcomes first, Navicat BI dashboards can provide actionable insights rather than simply displaying data.

Navicat BI at a Glance

Business Intelligence ChallengeNavicat BI Benefit
Large Volumes of DataInteractive Data Exploration
Static Spreadsheet ReportingDynamic Dashboards
Poor Data VisibilityVisual Business Insights
Slow Decision-MakingFaster Data Interpretation
Disconnected Information SourcesCentralized Analysis
Limited Reporting CapabilitiesFlexible Visualisation Tools

Helpful Navicat Resources

  • Navicat BI
    Explore dashboard creation, business intelligence capabilities, data analysis features, and interactive reporting tools.

  • Navicat Features Overview
    Learn more about database management, data modelling, visualization, monitoring, and analytics capabilities.

  • Navicat Product Comparison
    Compare Navicat solutions and identify the right product for database administration, modelling, monitoring, and analytics.

Request a Navicat BI Quotation

Whether your organization is building management dashboards, tracking operational performance, or introducing business intelligence capabilities, Navicat BI helps transform database information into actionable insights.

BINTARA can assist your organization in reviewing Navicat BI requirements, evaluating user quantities, and selecting the most suitable licensing option.